
Drive Business Success with Quality Tools

Quality tools are indispensable in quality management because they provide structured methodologies, enable data-driven decision-making, enhance process efficiency, and ultimately contribute to the delivery of high-quality products and services, customer satisfaction, and overall business success.
8D Problem-Solving
8D problem solving is a systematic and structured approach used by organizations to identify, analyze, and solve complex problems or issues. The “8D” stands for “8 Disciplines,” which represent the eight steps or phases in the problem-solving process. The goal of 8D problem solving is to address problems comprehensively, prevent their recurrence, and improve overall processes.
- Form a cross-functional team with the necessary skills.
- Clearly define the issue and gather relevant data.
- Implement temporary measures to prevent further issues.
- Analyze the problem’s origin using techniques like “Ishikawa diagram”
- Develop and implement long-term solutions to eliminate the root cause.
- Put the solutions into practice and ensure they work as intended.
- Implement actions to prevent the problem from happening again.
BPA bring tools to streamline problem solving, automate processes, develop teamworking and find similarities with AI.
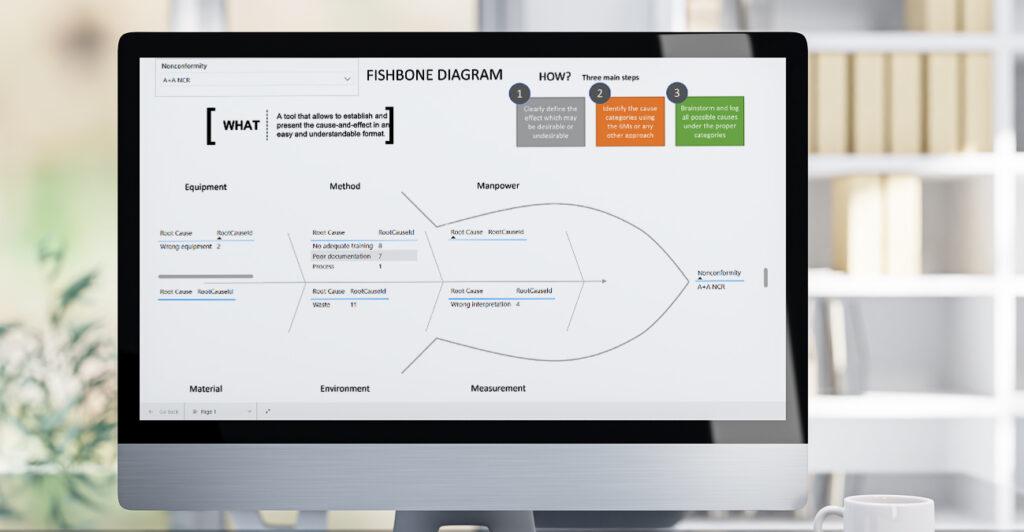 The Ishikawa diagram in Power BI shows root causes which caused a nonconformity.
Process Flowchart
A process flowchart is a visual representation of a sequence of activities or steps within a process and helps organizations document, analyze, and improve their processes. Quality management involves ensuring that products or services meet or exceed customer expectations and adhere to established quality standards. Process flowcharts are used to achieve this by providing a clear, detailed overview of how a process works.
Flowcharts serve as a means to document each step of a process. This documentation can be used to communicate the process to employees, stakeholders, and auditors. It ensures that everyone understands the process’s structure and can follow it consistently. In quality management, it’s crucial to standardize processes to ensure consistent quality. Flowcharts provide a basis for creating and implementing standardized procedures and best practices.
By using visual process maps in BPA software, end users understand how your company works and learn about underlying process regulations.
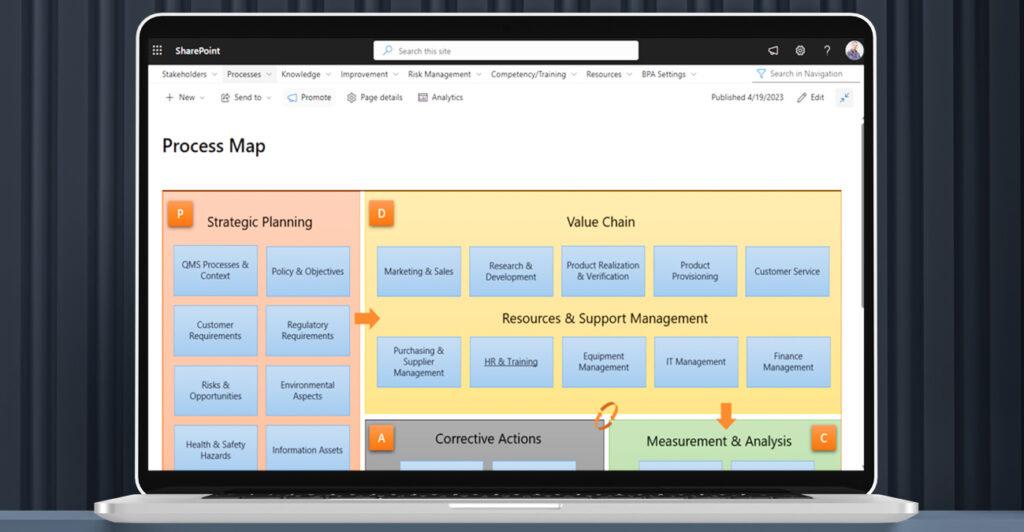 The interactive process map helps collaborators to understand how the company works.
Risk Analysis
Risk analysis is a systematic process of identifying, assessing, and managing risks that could potentially impact the quality of a product or service. Risk analysis helps organizations proactively identify and mitigate potential issues that could affect quality.
Common methods for identifying risks include brainstorming sessions, process mapping, and reviewing historical data. Once risks are identified, they are assessed based on their potential impact and likelihood of occurrence. This assessment helps prioritize which risks need the most attention. After assessing the risks, strategies are developed to mitigate or control them. These strategies can include process improvements, changes in procedures, enhanced training, or the implementation of specific controls or safeguards. The goal is to reduce the likelihood and impact of identified risks. Risk analysis is an ongoing process. Organizations should continuously monitor and review the effectiveness of their risk mitigation measures.
BPA software guides you managing risks and hazards based on common methodologies – like FMEA, GAMP5 – and remind responsible persons when risks need to be assessed.
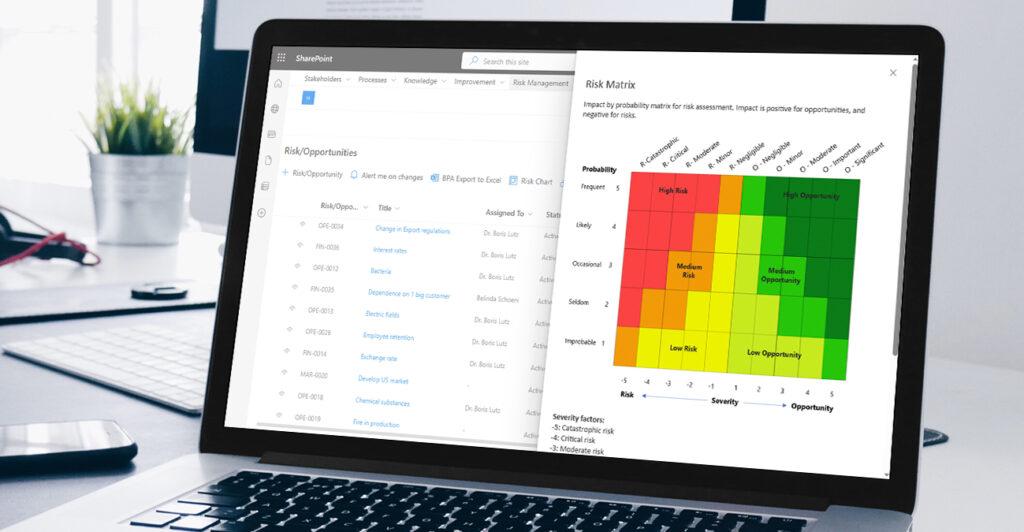
The risk management solution develops a preventive mindset for the organization.
Skill Matrix/Document Training Matrix
A skill matrix is a tool or document used to assess and manage the skills and competencies of individuals within an organization, especially in the context of quality management. It helps businesses ensure that they have the right people with the right skills in the right positions to meet quality objectives and standards.
A skill matrix begins with the identification of the specific skills and competencies that are relevant to the quality management processes within the organization.
Once the necessary skills are identified, employees’ skills and competencies are assessed and evaluated against these criteria. Skill matrices are valuable for identifying skill gaps within the organization. When there is a misalignment between the required skills and the skills possessed by employees, it becomes evident through the matrix. This information can guide training and development efforts.
BPA software provides solutions to evaluate collaborator skills to do their job and visualize results in an interactive Power BI skill matrix. Also, we make sure collaborators understand important procedures by using a document training matrix.
 The interactive skill matrix in Power BI simplifies collaborator skill assessment and training follow-up.
Customer Satisfaction Surveys
Customer surveys are a valuable tool in quality management because they provide actionable insights, drive continuous improvement, and help organizations align their products and services with customer expectations, ultimately leading to better customer satisfaction and business success.
BPA software and Microsoft 365 bring simple tools to design your own surveys at no cost for customers and get interactive Power BI reports about customer satisfaction.

Share satisfaction surveys with customers at no cost.
Pareto Chart
A Pareto chart is a graphical tool used in quality management and various other fields to prioritize and analyze data, particularly when dealing with quality improvement and problem-solving. It is named after Vilfredo Pareto who observed that roughly 80% of the effects come from 20% of the causes, a concept known as the Pareto Principle or the 80/20 rule.
A Pareto chart is typically used to help visually identify the most critical issues or factors contributing to a problem or outcome. The left side of the chart contains the most important elements, while the right side contains less significant ones. Once the key factors or causes are identified, resources and efforts are allocated to address the most significant issues by priority.
BPA software has a prebuilt Pareto chart component ready to be used for tracking the most important incident root causes to address or other nonconformities to solve.
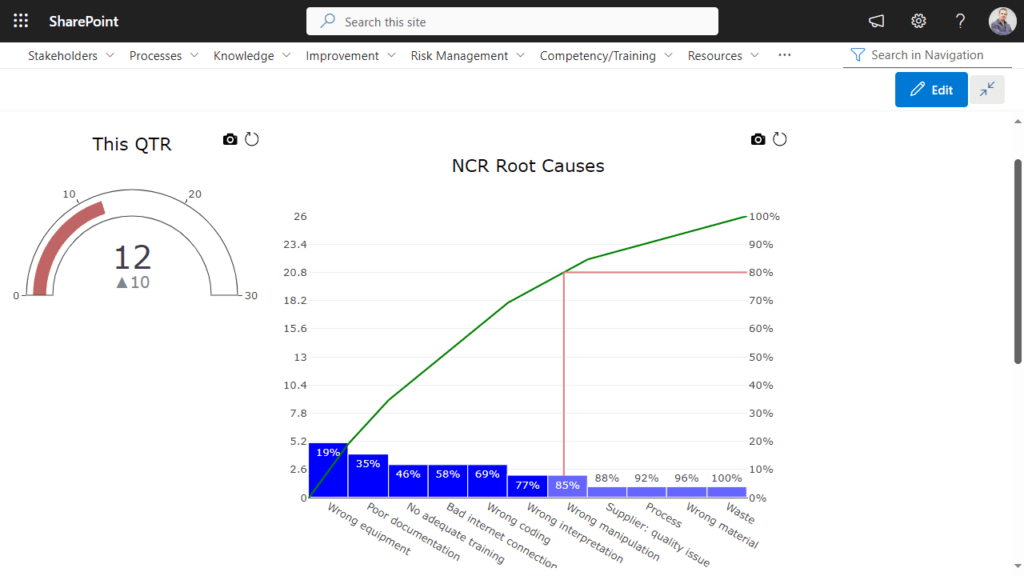
Nonconformity dashboard with a Pareto diagram.
Turtle Diagram
Turtle Diagrams are often used in process audits and quality management to provide a comprehensive visual representation of a process. Auditors can use them to systematically assess the effectiveness and efficiency of a process by examining each of these categories. It helps ensure that all aspects of the process, including inputs, activities, controls, and outputs, are considered during the evaluation, leading to a more thorough understanding of the process and potential areas for improvement.
The Turtle Diagram typically consists of several key elements or categories, which help in systematically documenting and analyzing a process:
- Process is the central element of the diagram, representing the specific process being analyzed or audited.
- Inputs represents the various inputs or resources required for the process to function.
- Outputs represent the results or products generated by the process.
- Activities are the specific tasks or activities involved in the process.
- Controls refer to the measures and mechanisms put in place to ensure the process functions effectively and produces quality outputs.
- Resources encompass the people, materials, equipment, and technology needed to carry out the process.
- Feedback loops are essential for continuous improvement.
BPA QMS software is process-centric from design, giving process owners all the solutions to continuously improve their processes. The Power BI turtle diagram shows all important facts for each process.
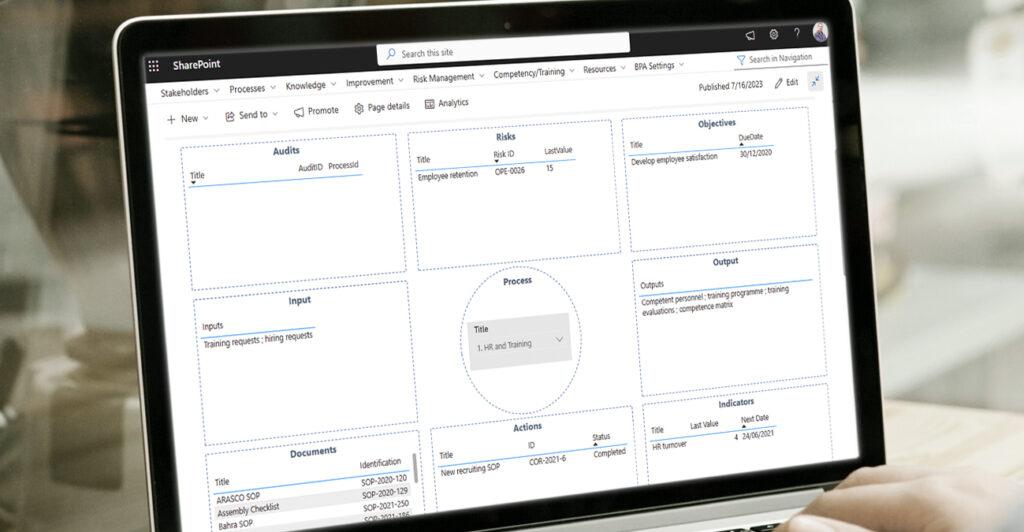 The Turtle diagram shows all important information about processes.


